


Contents
- 1 Quick Answer
- 2 Top 10 Website Speed Statistics for 2026
- 3 What Is Website Load Time?
- 4 What Is the Average Website Load Time in 2026?
- 5 How Website Speed Affects User Behavior
- 6 How Website Speed Affects Conversions and Revenue
- 7 Website Speed and SEO: What Google Measures
- 8 Core Web Vitals: The Metrics That Actually Matter
- 9 What Slows a Website Down?
- 10 Mobile vs. Desktop Speed: The Performance Gap
- 11 Website Speed by Industry
- 12 Tools to Measure Your Website Speed
- 13 How to Improve Website Speed
- 14 The Future of Website Load Time
- 15 Conclusion
Quick Answer
How fast should a website load in 2026? The industry benchmark is under 2 seconds. The current average is 2.5 seconds on desktop and 8.6 seconds on mobile. If your site takes more than 3 seconds to load, you are losing more than half your mobile visitors before they see a single word of your content.
Top 10 Website Speed Statistics for 2026
Before diving deep, here are the numbers you need to know right now.
- 53% of mobile users abandon a site that takes more than 3 seconds to load
- 47% of users expect any website to load in under 2 seconds
- 2.5 seconds – average desktop load time in 2026
- 8.6 seconds – average mobile load time in 2026 (still far too slow)
- 20% drop in conversions for every 1-second delay in mobile load time
- 16% drop in user satisfaction with just a 3-second delay
- 75%+ of a webpage’s total weight comes from images alone
- 67% of websites now achieve a good Largest Contentful Paint (LCP) score
- 40 million+ websites use a CDN to improve delivery speed
- 2.6 billion in revenue is lost each year globally due to slow-loading websites
These numbers tell one clear story: speed is not a technical nicety. It is a direct driver of user experience, search rankings, and business revenue.
What Is Website Load Time?
Website load time is the total time it takes for a web page to fully display its content after a user enters a URL or clicks a link. It is measured in seconds and varies based on the user’s device, internet connection, browser, and the website’s technical infrastructure.
Load time covers several distinct events: the first byte of data arriving from the server (Time to First Byte / TTFB), the first visible content rendering on screen (First Contentful Paint / FCP), the largest visible element loading (Largest Contentful Paint / LCP), and the page becoming fully interactive.
Each of these moments affects how a real user perceives speed, and Google measures all of them.
Why does it matter? Because even a fraction of a second separates a visitor who stays from a visitor who leaves. In 2026, users compare every website to the near-instant experiences delivered by mobile apps. Anything slower feels broken.
What Is the Average Website Load Time in 2026?
| Device | Average Load Time | Industry Benchmark |
| Desktop | 2.5 seconds | Under 2 seconds |
| Mobile | 8.6 seconds | Under 3 seconds |
| WordPress (Desktop) | 2.5 seconds | Under 2 seconds |
| WordPress (Mobile) | 13.25 seconds | Under 3 seconds |
Desktop performance is improving, with 2.5 seconds nearing the 2-second benchmark. Mobile is the problem. An 8.6-second average mobile load time means the typical website is failing the majority of its visitors, since 58% of all global internet traffic now comes from mobile devices.
For ecommerce specifically, the stakes are even higher. To reach the average 3.05% ecommerce conversion rate, pages need to load in under 2 seconds. Every additional second compounds the revenue loss.
How Website Speed Affects User Behavior
Users in 2026 are not patient. Decades of faster devices and faster networks have raised expectations dramatically. Here is exactly what the data says about how users behave when pages are slow.
Abandonment thresholds:
- 3% of mobile users leave if a page takes more than 1 second to load
- 53% leave if it takes more than 3 seconds
- 75% of mobile users have already experienced a website they considered too slow – rating it as the single most common web frustration, above error messages, bad formatting, broken functionality, and site unavailability
Frustration curve:
- 54% of users say their frustration increases as a brand’s mobile load time increases
- 16% drop in customer satisfaction with each 3-second delay
- 44% of shoppers who have a bad speed experience share it with others,making slow speed a brand reputation risk, not just a technical metric
Bounce rate impact:
- As page load time increases from 1 second to 10 seconds, the probability of a bounce increases by 123%
- A 2-second delay pushes shopping cart abandonment rates to 87%
The pattern is consistent and steep.
How Website Speed Affects Conversions and Revenue
This is where slow speed stops being a user experience issue and becomes a financial one.
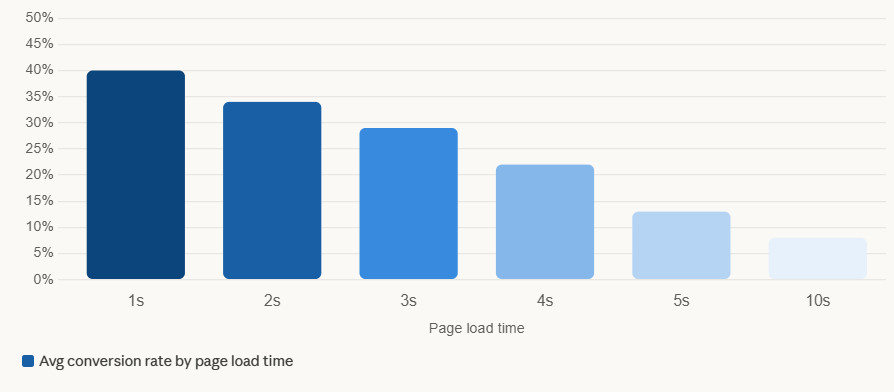
Conversion rate by load time (industry data):
| Page Load Time | Average Conversion Rate |
| 1 second | ~40% |
| 2 seconds | ~34% |
| 3 seconds | ~29% |
| 5 seconds | B2B rate drops 3x vs. 1 second |
| 10 seconds | B2B rate drops 5x vs. 1 second |
Key conversion statistics:
- A 1-second delay reduces conversions by 7%, which can cost large businesses millions per year
- A 1-second mobile delay specifically cuts conversion rates by 20%
- 79% of shoppers dissatisfied with site speed say they are less likely to purchase from the same site again
- Nearly 70% of consumers say page speed directly impacts their willingness to buy from an online retailer
- Online businesses collectively lose approximately 2.6 billion annually due to slow load times
For B2B websites specifically, the conversion gap is dramatic. A site that loads in 1 second converts at 3 times the rate of a 5-second site, and 5 times the rate of a 10-second site. Speed is not just a user preference. It is a sales multiplier.
Website Speed and SEO: What Google Measures
Speed has been a Google ranking factor since 2010. In 2026, it matters more than ever and on three separate fronts.
Traditional SEO: Google has confirmed that page speed is a ranking signal for both desktop and mobile search. Slow pages receive lower rankings, meaning fewer organic visitors ever even reach your site.
Core Web Vitals: In 2021, Google formalized speed metrics into a suite of signals called Core Web Vitals, which directly influence page experience rankings. These are real user data signals pulled from Chrome users’ actual browsing sessions, not just lab tests.
Generative Engine Optimization (GEO): This is newer and underappreciated. Faster websites are easier for AI crawlers to access and process, increasing the likelihood of your content being included in AI-generated answers from tools like Google AI Overviews, ChatGPT browsing, and Perplexity. Slow sites are simply processed less often by these crawlers, meaning speed now affects your AI visibility, not just your search ranking.
Crawl budget: Google allocates a limited crawl budget to each website. Faster sites allow Google to crawl more pages in each session, improving overall indexation. Slow sites waste crawl budget on fewer pages, leaving content unindexed and invisible.
Core Web Vitals: The Metrics That Actually Matter
Google’s Core Web Vitals are the standard measurement framework for website performance in 2026. There are three primary metrics every site owner needs to understand and optimize.
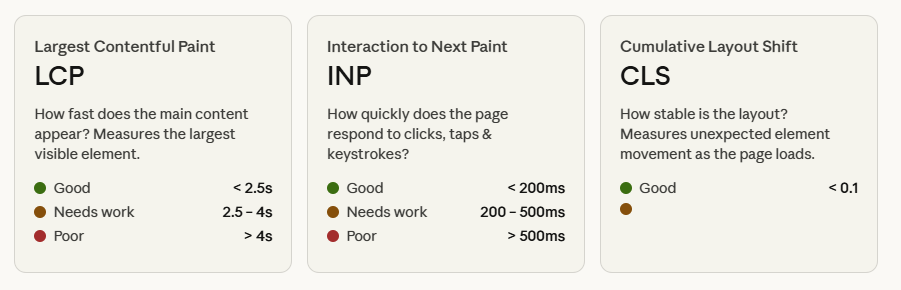
Largest Contentful Paint (LCP) Measures how quickly the largest visible element on the page loads, typically a hero image, video thumbnail, or main heading. It reflects the user’s perception of whether the page is “loaded.”
- Good: Under 2.5 seconds
- Needs improvement: 2.5 to 4 seconds
- Poor: Over 4 seconds
- Current benchmark: 67% of websites now achieve a good LCP score
Interaction to Next Paint (INP) Replaced First Input Delay (FID) in 2024 as the interactivity metric. Measures the delay between a user’s action (click, tap, key press) and the page’s visual response.
- Good: Under 200ms
- Needs improvement: 200ms to 500ms
- Poor: Over 500ms
Cumulative Layout Shift (CLS) measures visual stability, how much the page layout unexpectedly jumps around as content loads. A high CLS score means users are clicking the wrong things because elements are moving while the page loads.
- Good: Under 0.1
- Needs improvement: 0.1 to 0.25
- Poor: Over 0.25
Current pass rates:
- 53% of desktop websites pass Core Web Vitals assessment
- 41% of mobile websites pass Core Web Vitals assessment
The gap between desktop and mobile CWV pass rates highlights exactly where the industry’s performance problem sits.
Additional speed targets to aim for:
- PageSpeed Score: 90 or above
- Server response time (TTFB): under 500ms
- Overall load time: under 2 seconds
What Slows a Website Down?
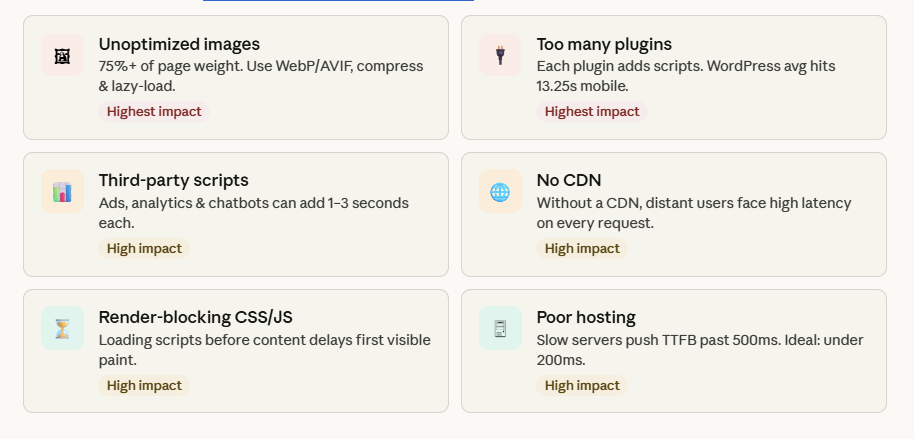
Unoptimized Images – Images (75% of page weight) slow sites if not compressed or properly formatted (WebP/AVIF).
Too Many Plugins – Extra or poorly coded plugins add heavy scripts and increase load time (e.g., WordPress ~13.25s mobile).
Third-Party Scripts – Tools like ads, analytics, a
nd chatbots can add 1–3 seconds if not optimized.
No CDN – Without a CDN, users far from the server face higher latency.
Render-Blocking CSS/JS – Loading CSS/JS before content delays page display.
Poor Hosting – Slow servers and bad infrastructure increase response time (ideal TTFB < 500ms).
Mobile vs. Desktop Speed: The Performance Gap
The gap between mobile and desktop performance is the defining challenge of web performance in 2026.
| Metric | Desktop | Mobile |
| Average load time | 2.5 seconds | 8.6 seconds |
| WordPress avg. load time | 2.5 seconds | 13.25 seconds |
| CWV pass rate | 53% | 41% |
| Users who abandon at 3s | _ | 53% |
| Share of global traffic | 42% | 58% |
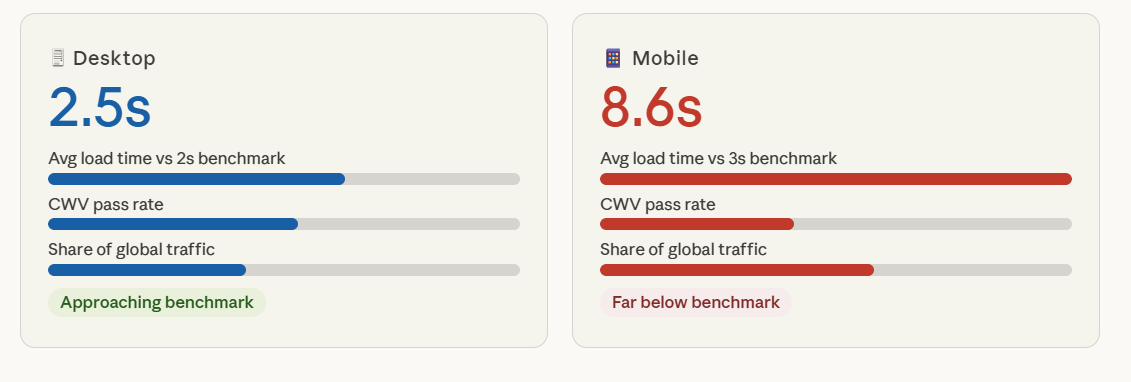
Mobile devices carry more internet traffic than desktop, yet mobile performance is more than three times slower. This is the core contradiction the web industry has still not fully resolved.
Why does the gap persist? Mobile devices generally have less processing power. Mobile connections are more variable than wired or Wi-Fi connections. And many websites were built desktop-first and then adapted for mobile, rather than built mobile-first from the start.
In 2026, the focus has shifted from infrastructure to on-device performance, improving JavaScript, rendering, and responsiveness with lighter code and mobile-first design.
58% of global internet traffic comes from mobile. Treating mobile optimization as optional is choosing to perform poorly for the majority of your audience.
Website Speed by Industry
Ecommerce: The highest stakes. Conversion rates drop sharply with each second of delay. At 1 second, average conversion is around 40%. At 3 seconds, it falls to 29%. A two-second delay increases cart abandonment rates to 87%.
B2B / SaaS: Slower pages have an outsized conversion impact. A 1-second site converts at 3x the rate of a 5-second site for B2B buyers – who are often on corporate networks and making high-consideration decisions where trust signals matter.
Publishing / Media: High page weight from images and videos, combined with heavy advertising scripts, makes these sites particularly vulnerable to poor performance. Slow media sites see dramatically higher bounce rates, which reduces ad impressions and revenue per visitor.
Healthcare and Finance: Users seeking medical or financial information are often in a time-sensitive or high-anxiety state. Slow load times in these sectors correlate with higher abandonment and lower trust scores.
Local Business: Mobile performance is critical for local search. Users finding a restaurant, service provider, or local store are often on mobile with an immediate intent to act. A slow local business website loses foot traffic directly.
Tools to Measure Your Website Speed
Before optimizing, you need to measure. These are the industry-standard tools for assessing website performance in 2026.
Google PageSpeed Insights – A free tool to test website speed and see performance issues, along with improvement suggestions.
Google Search Console – A free tool to track Core Web Vitals and identify pages with performance issues.
GTmetrix – Free tool for detailed speed analysis and identifying bottlenecks.
Pingdom Website Speed Test – Free, simple tool for quick speed checks and performance insights.
WebPageTest – Free advanced tool with detailed load analysis and real-world testing.
Chrome DevTools (Lighthouse) – Free built-in Chrome tool to test and audit website performance.
How to Improve Website Speed
These are the highest-impact optimizations available in 2026, ranked roughly by effort-to-impact ratio.
Optimize and compress images Optimize images by using WebP/AVIF formats, compressing without quality loss, enabling lazy loading, and serving responsive sizes, this can reduce page weight by 40–60%.
Use a CDN: Distribute your static assets (images, CSS, JavaScript) through a CDN. Users worldwide receive content from a geographically nearby server. Reduces TTFB and LCP significantly for global audiences.
Enable caching by using browser and server-side caching, along with GZIP or Brotli compression to reduce load time and file size.
Minimize and defer Remove unused code, defer non-critical scripts, and reduce requests.
Audit and reduce third-party scripts: Every tag manager, analytics script, ad pixel, and chatbot widget adds load time. Load non-critical third-party scripts asynchronously or defer them until after the page is interactive. Remove scripts you no longer actively use.
Choose quality hosting: Better hosting can cut server response time from 2s+ to under 200ms.
Upgrade to HTTP/2 or HTTP/3: Modern HTTP protocols significantly reduce the number of round-trips required to load a page. HTTP/2 multiplexing allows multiple files to load simultaneously. Most quality hosts now support this by default.
Reduce plugin count (WordPress) Every active plugin adds overhead. Audit plugins regularly. Replace multiple plugins with one well-coded alternative where possible. Eliminate plugins whose functionality you no longer use.
The Future of Website Load Time
The infrastructure problem is largely solved. CDN coverage is near-universal among serious web platforms. Modern cloud hosting is fast, scalable, and affordable. Compression and caching are standard. These are now table stakes, not differentiators.
The 2026 challenge is what happens after delivery. The bottleneck has moved from the network to the device: JavaScript execution time, rendering performance, interaction responsiveness, and layout stability on the device itself. This means that performance in 2026 and beyond is primarily a coding discipline, not an infrastructure one.
Five trends defining the next phase:
- AI-driven performance optimization – Tools are emerging that automatically identify and fix performance issues, compress assets, and optimize delivery in real time without manual developer intervention. AI will reduce the expertise barrier for speed optimization significantly.
- Edge computing – Running code at the CDN edge (closer to the user) rather than at the origin server reduces latency for dynamic content, not just static assets. Platforms like Cloudflare Workers and Vercel Edge Functions are making this accessible to non-enterprise teams.
- Core Web Vitals evolution – Google is expected to continue refining CWV metrics, with growing emphasis on Interaction to Next Paint (INP) and responsiveness. Brands that optimize for real-world interactivity, not just initial load speed, will have the ranking advantage.
- Speed as AI crawlability – As AI-driven search grows, fast and cleanly rendered websites are more likely to be processed and cited by AI crawlers. Speed is no longer just a ranking signal for traditional search, it is becoming a visibility signal for AI search as well.
- 5G expansion – As 5G penetration grows globally, mobile network latency will reduce significantly. However, device processing power will remain the limiting factor for JavaScript-heavy sites, meaning code efficiency will matter more, not less.
Conclusion
In 2026, website speed sits at the intersection of user experience, search engine rankings, AI visibility, and direct revenue performance. The data is unambiguous: slow sites lose visitors, lose conversions, lose rankings, and lose money.
The average mobile load time of 8.6 seconds is not just a statistic. It represents a majority of websites failing a majority of their visitors, on the device that carries the majority of internet traffic. That is a significant, correctable gap between where the industry is and where user expectations have been for years.
The good news: the tools, techniques, and infrastructure to fix it have never been more accessible. CDNs, modern hosting, image optimization pipelines, and performance auditing tools are available to businesses of every size.
Netstager is a leading digital marketing agency in Dubai and one of the most trusted web design and digital marketing companies in India, offering SEO, Google Ads, social media marketing, web design, mobile apps, branding, and software development to help businesses build a powerful and results-driven online presence. Whether you’re looking for creative digital strategies, performance-focused marketing, or technology-driven web solutions, our teams deliver end-to-end services that help brands grow and connect effectively with their audience. For more details, visit our UAE and India websites for support.
Contact Our Development Team Today: At +91 844 844 0112 or reach out via email at [email protected].
